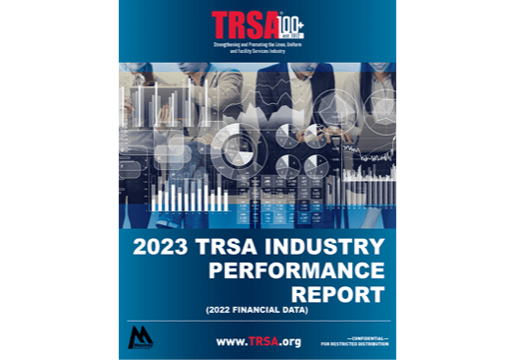
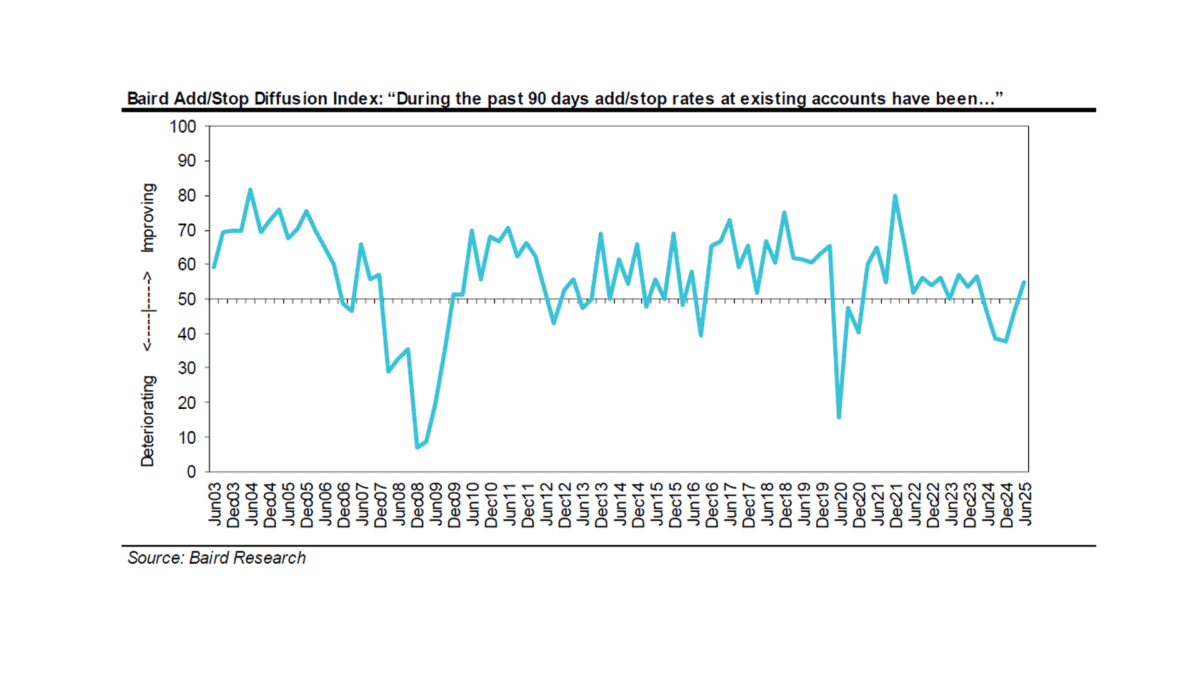
TRSA’s recently released Industry Performance Report shows some financial indicators improving above pre-COVID levels, while healthcare is still recovering with profit margin, return-on-net-worth and return-on-assets trends. Using 2022 financial data collected from TRSA members on a confidential basis and compiled by the MacKay Research Group, Boulder, CO, the TRSA report is the only industrywide research report that enables operators to compare their income statements, balance sheets, and financial and employee productivity ratios.
Profit margin, or return on sales, improved in 2022 only for the F&B market (6.2% to 7.0%) while every other market segment had a decline compared to 2021. Industrial dipped from 6.9% to 6.3%, healthcare went from an inflated 12.2% in 2021 to 6.3% and mixed-use operators went from 15.9% to 9.1%. Compared with the pre-pandemic year 2019, profit margin was almost flat for operators specializing in the industrial segment (6.4% to 6.3%) and the healthcare segment is slightly below 2019 (7.9% to 6.3%). Surpassing 2019 profit margins were F&B (4.7% to 7.0%) and mixed-use (5.6% to 9.1%).
The report enables operators specializing in these customer industries to compare a variety of their productivity, efficiency and financial performance metrics from the last five years with other such specialists. Such comparison also is fostered within these demographics:
- Annual sales volume (under $8 million, $8M-$12M, $12M-$30M, $30M+)
- Number of locations (single, multiple)
Income statements for each demographic contain a total of 22 expense line items categorized as merchandise, plant, delivery, or sales and administrative, each reported as a percent of sales and cost-per-pound. Return-on-investment and product profiles report strategic profit model ratios, sales by market, pounds per operator hour and delivery costs per route. Productivity statistics for each category include its number of employees and wage/salary costs by job function, turnover and sales per employee.
The TRSA Financial Performance Report Excel dashboard offers an interactive, dynamic look at the columns of data to be used for benchmarking. This management tool is 100% customizable. Results profiled in the report are based on income statement, balance sheet and operating data provided by 39 operators. The tables and graphs are designed to provide comprehensive, yet straightforward guidelines for analyzing profitability. The management tool is intended to supply the resources that enable TRSA members to evaluate, plan and better manage their business.
The report and dashboard have been distributed at no charge to participants who responded to the survey and is now available for purchase by both TRSA members and nonmembers and includes the full report plus an excel dashboard at www.trsa.org/store.
Publish Date
September 15, 2023
Categories
Sign Up For Our Newsletter
Receive the latest updates on the linen, uniform and facility services industry from TRSA delivered straight to your inbox.


