
TRSA’s recently released Industry Performance Report indicates a return to parity in profitability between operators serving different customer industry markets typical of the pre-COVID era. Built from a survey of financial data collected confidentially from TRSA members by MacKay Research Group, Boulder, CO, the one-of-a-kind industrywide report enables operators to compare income statements, balance sheets, and financial and employee productivity ratios.
Median profit margins for survey respondents specializing in F&B (restaurant), healthcare or industrial businesses and those with a more balanced customer industry base (mixed) varied relatively little between these four segments from 2013 to 2019. Each segment’s median typically fell in the 5% to 10% range. That norm disappeared in 2020 when the F&B median went negative and mixed fell below. Compared with the healthcare and industrial segments in 2021, those sectors posted huge profitability gains, with F&B back in the historic range and mixed exceeding it. The most recent report, covering 2022, indicates all four are now back in the range.
The report enables operators specializing in these customer industries to compare a variety of their productivity, efficiency and financial performance metrics from the last five years with other such specialists. Such comparison also is fostered within these demographics:
- Annual company sales volume (under $8 million, $8M-$12M, $12M-$30M, $30M+)
- Number of locations (single, multiple)
Income statements for each demographic contain a total of 22 expense line items categorized as merchandise, plant, delivery, or sales and administrative, each reported as a percent of sales and cost-per-pound. Return on investment and product profiles report strategic profit model ratios, sales by market, pounds per operator hour and delivery costs per route. Productivity statistics for each category include its number of employees and wage/salary costs by job function, turnover and sales per employee.
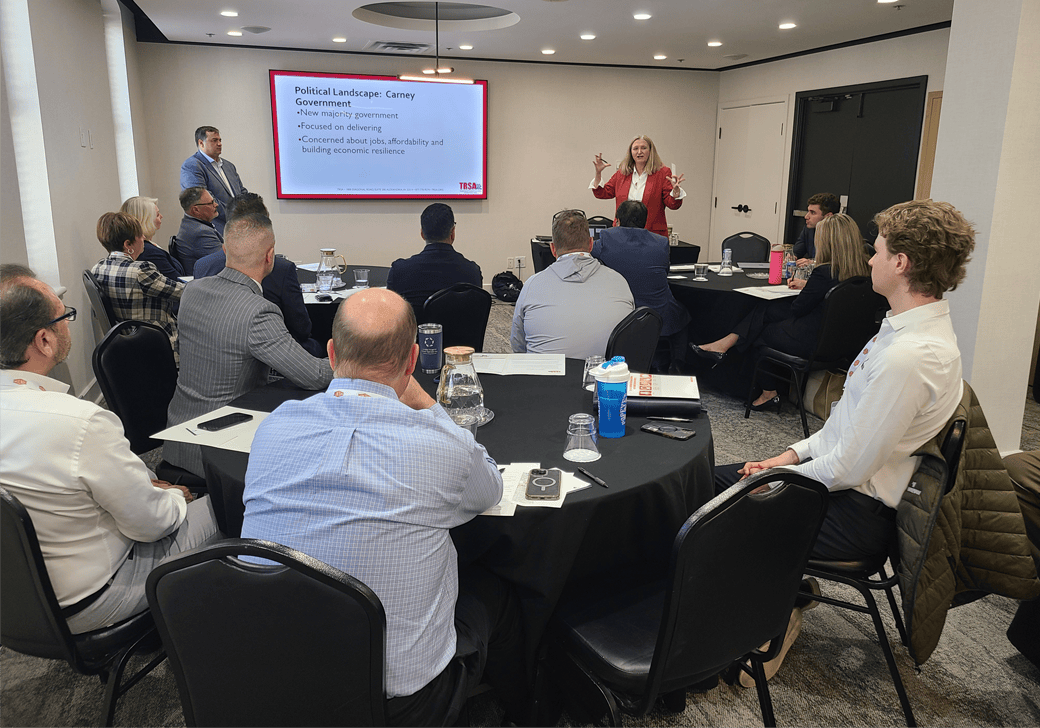
Thirty-nine member operators filled out the surveys that generated this year’s TRSA Industry Performance Report. The report has been distributed at no charge to participants who responded to the survey and is now available for purchase by both TRSA members and nonmembers at www.trsa.org/store.


Sign Up For Our Newsletter
Receive the latest updates on the linen, uniform and facility services industry from TRSA delivered straight to your inbox.